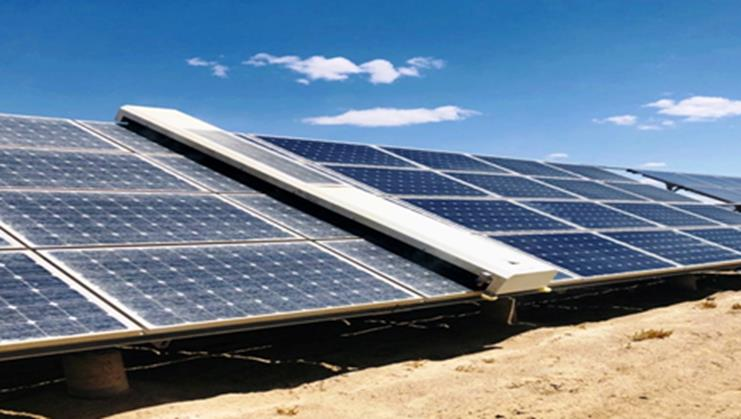
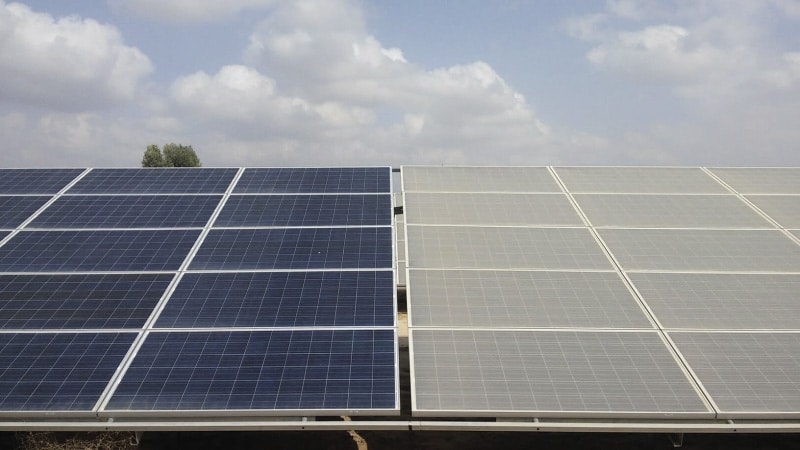
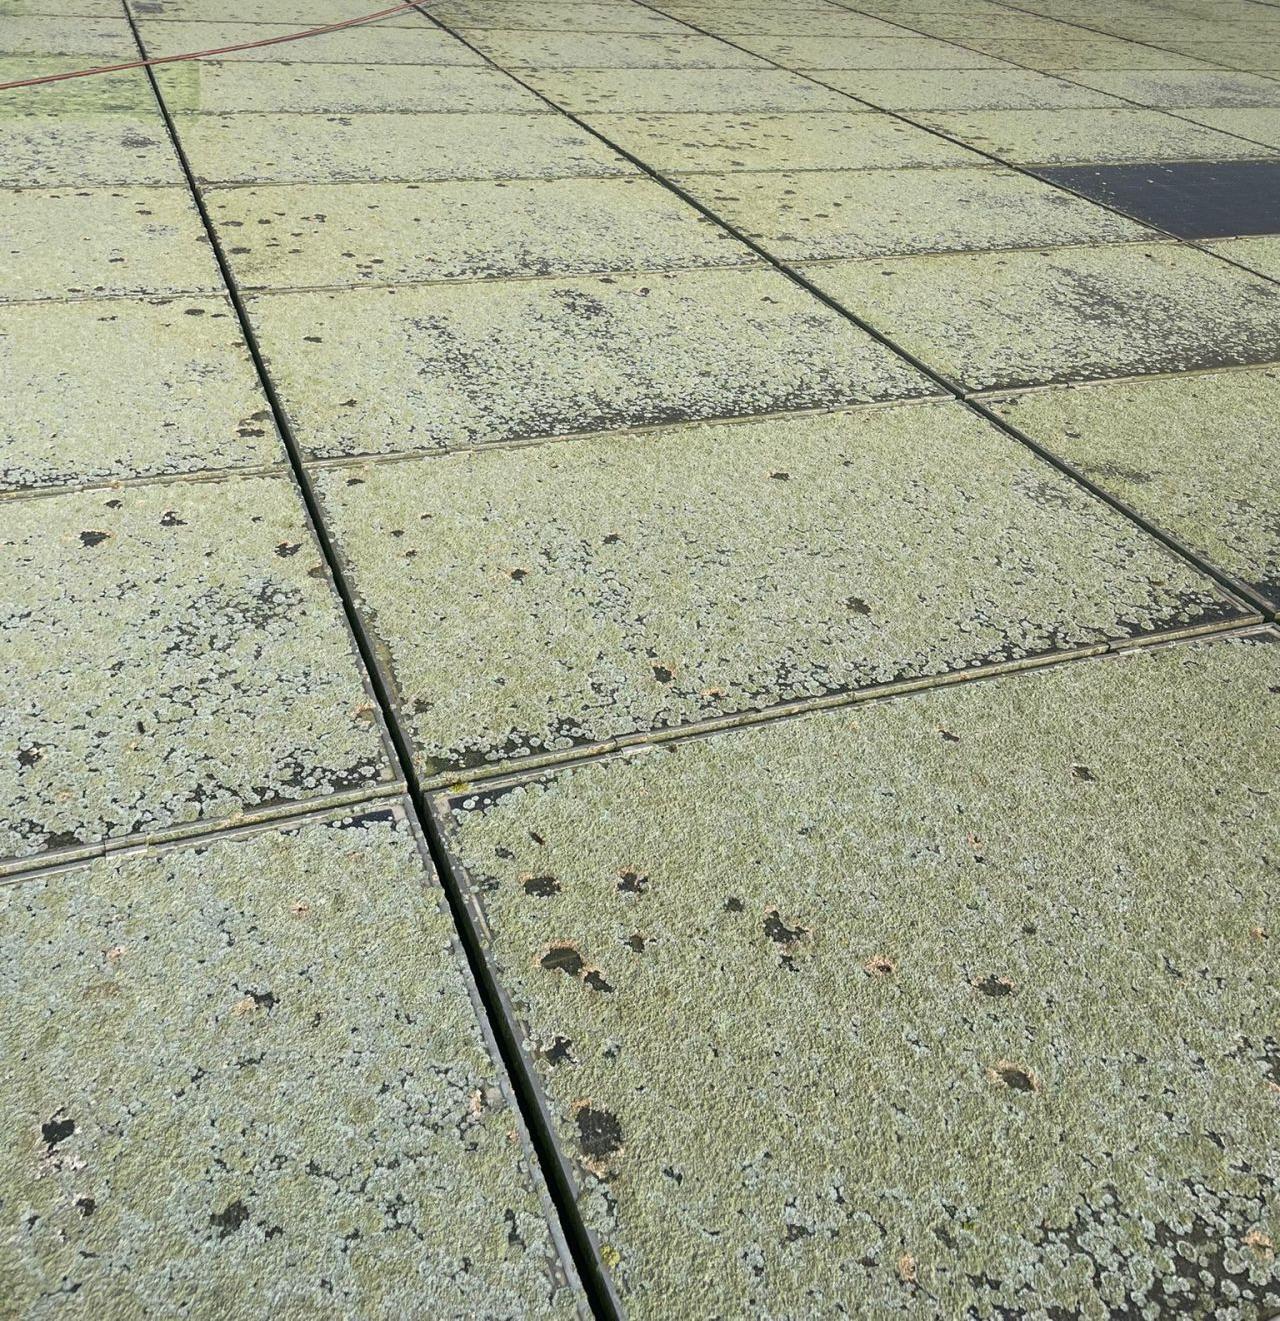
The level of contamination on photovoltaic power plants directly affects their power generation efficiency and economic benefits. For better management and maintenance of photovoltaic plants, it is crucial to understand the definitions and calculation methods of mild, moderate, and severe pollution, as well as cleaning frequency recommendations under different scenarios based on cleaning robot recommendations.
1. Mild Pollution
Definition:
Mild pollution refers to minimal accumulation of contaminants on the surface of solar panels, having a small impact on power generation efficiency. It typically includes slight dust, small stains, or minor bird droppings.

Evaluation Indicators:
- Contaminant Accumulation: ≤ 50 mg/m².
- Soil Loss Index (SLI): Monthly average SLI < 2%.
- Daily Soil Loss (DSL): DSL < 1%.
- Relative Error (RE): RE ≤ 5%.
- Root Mean Square Error (RMSE): RMSE ≤ 10%.
Calculation Formulas:
- Relative Error (RE):
RE = (X - Y) / X * 100%
Where X is the actual daily photovoltaic power generation, and Y is the predicted daily photovoltaic power generation.
- Root Mean Square Error (RMSE):
RMSE = sqrt(1/n * sum((X_i - Y_i)²))
Where X_i is the actual daily photovoltaic power generation, Y_i is the predicted daily photovoltaic power generation, and n is the number of elements in the test sample.
Cleaning Frequency Recommendations:
- Zonas desérticas: Weekly, due to frequent sandstorms that lead to quick pollution accumulation.
- Áreas rurales: Every 2 months, since rural areas are relatively clean with minor dust and bird droppings.
- Áreas urbanas: Monthly, as urban areas have higher air pollution and rapid contaminant accumulation.
- Áreas industriales: Weekly, due to large quantities of pollutants emitted causing rapid panel dirtiness.
- Zonas costeras: Every 3 months, as higher humidity with minimal salt impact and natural rainfall cleans the panels.
- Áreas agrícolas: Every 2 months, since pesticide residues and dust are present but overall pollution is lower.
2. Contaminación moderada
Definition:
Moderate pollution involves significant accumulation of contaminants on solar panels, noticeably impacting power generation efficiency. It typically involves thicker dust layers, noticeable stains, or more bird droppings.

Evaluation Indicators:
- Contaminant Accumulation: 50 mg/m² to 200 mg/m².
- Soil Loss Index (SLI): Monthly average SLI 2% to 4%.
- Daily Soil Loss (DSL): DSL between 1% and 3%.
- Relative Error (RE): RE between 5% and 15%.
- Root Mean Square Error (RMSE): RMSE between 10% and 20%.
Calculation Formulas:
- Soil Loss Index (SLI):
SLI = (P_clean - P_dirty) / P_clean * 100%
Where P_clean is the power generation after cleaning, and P_dirty is the power generation after contamination.
- Daily Soil Loss (DSL):
DSL = (P_clean_daily - P_dirty_daily) / P_clean_daily * 100%
Where P_clean_daily is the daily power generation after cleaning, and P_dirty_daily is the daily power generation after contamination.
Cleaning Frequency Recommendations:
- Zonas desérticas: 1-2 times weekly, due to frequent sandstorms.
- Áreas rurales: Every 1-2 months, especially during seasons with more dust and bird droppings.
- Áreas urbanas: Every 1-2 months, as pollution accumulates faster.
- Áreas industriales: 1-2 times weekly, because of heavy pollutant emissions.
- Zonas costeras: Every 2 months, as salt impact is greater and rainfall might not suffice.
- Áreas agrícolas: Every 1-2 months, due to pesticide residues.
3. Contaminación severa
Definition:
Severe pollution is characterized by extremely heavy accumulation of contaminants on solar panels, greatly affecting their power generation efficiency. Typically, this involves heavy dust layers, widespread stains, or large amounts of bird droppings.

Evaluation Indicators:
- Contaminant Accumulation: > 200 mg/m².
- Soil Loss Index (SLI): Monthly average SLI > 4%.
- Daily Soil Loss (DSL): DSL > 3%.
- Relative Error (RE): RE > 15%.
- Root Mean Square Error (RMSE): RMSE > 20%.
Calculation Formulas:
- Soil Loss Index (SLI):
SLI = (P_clean - P_dirty) / P_clean * 100%
Where P_clean is the power generation after cleaning, and P_dirty is the power generation after contamination.
- Daily Soil Loss (DSL):
DSL = (P_clean_daily - P_dirty_daily) / P_clean_daily * 100%
Where P_clean_daily is the daily power generation after cleaning, and P_dirty_daily is the daily power generation after contamination.
Cleaning Frequency Recommendations:
- Zonas desérticas: Every 3 days, or more frequently due to rapid contaminant accumulation.
- Áreas rurales: Monthly, even though relatively clean but certain seasons increase dirt.
- Áreas urbanas: Monthly, due to heavy pollution buildup.
- Áreas industriales: Every 3 days, industrial emissions cause quick dirt accumulation.
- Zonas costeras: Monthly, as humidity and salt affect the panels more.
- Áreas agrícolas: Monthly, due to pesticide residues and additional dust.
Cleaning Effect Evaluation
Improvements:
- Efficiency Increase: An example from Wuhan shows an 8MW rooftop photovoltaic plant can increase annual output by 720,000 kWh with a 10% efficacy improvement post-cleaning.
- Reducción de costos: Reduces roof maintenance costs and doesn’t require an expensive water system for maintenance while mitigating future labor cost increases.
Conclusión
The optimal cleaning cycle for photovoltaic power plants should dynamically adjust based on pollution severity and environmental conditions. Mild pollution requires cleaning every 7 weeks, moderate pollution every 1-2 months, and severe pollution every 1-2 weeks. Here are the cleaning recommendations based on different scenarios:
- Zonas desérticas: Mild – weekly, Moderate – 1-2 times weekly, Severe – every 3 days.
- Áreas rurales: Mild – every 2 months, Moderate – 1-2 months, Severe – monthly.
- Áreas urbanas: Mild – monthly, Moderate – 1-2 monthly, Severe – weekly.
- Áreas industriales: Mild – weekly, Moderate – 1-2 weekly, Severe – every 3 days.
- Zonas costeras: Mild – every 3 months, Moderate – every 2 months, Severe – monthly.
- Áreas agrícolas: Mild – every 2 months, Moderate – 1-2 monthly, Severe – monthly.
Consulte el método de cálculo detallado:Fórmulas de cálculo de los efectos de limpieza y los intervalos de limpieza de plantas fotovoltaicas
The application of intelligent cleaning systems significantly improves cleaning efficiency, reduces labor costs, and maximizes power generation. As a manufacturer of cleaning robots, continuous optimization of robot design and technology is essential to provide more efficient, reliable cleaning solutions for the sustainable development and efficient operation of photovoltaic power plants.